Skip to content
Independent Baseball Analysis Sat, August 1, 2026
Called Third
The Leadoff — Conventional Wisdom, Tested

The Park in Your Swing: Baseball's Buildings Bend the Swings Taken Inside Them. Fenway Bends Them Backwards.

Parks bend the swings inside them — sealed 2026 test: 3 of 4 metrics pass

hitting · 13 min read
Read the analysis →
Fig.1 — Called-strike rate by location
2025 baseline · inside → away
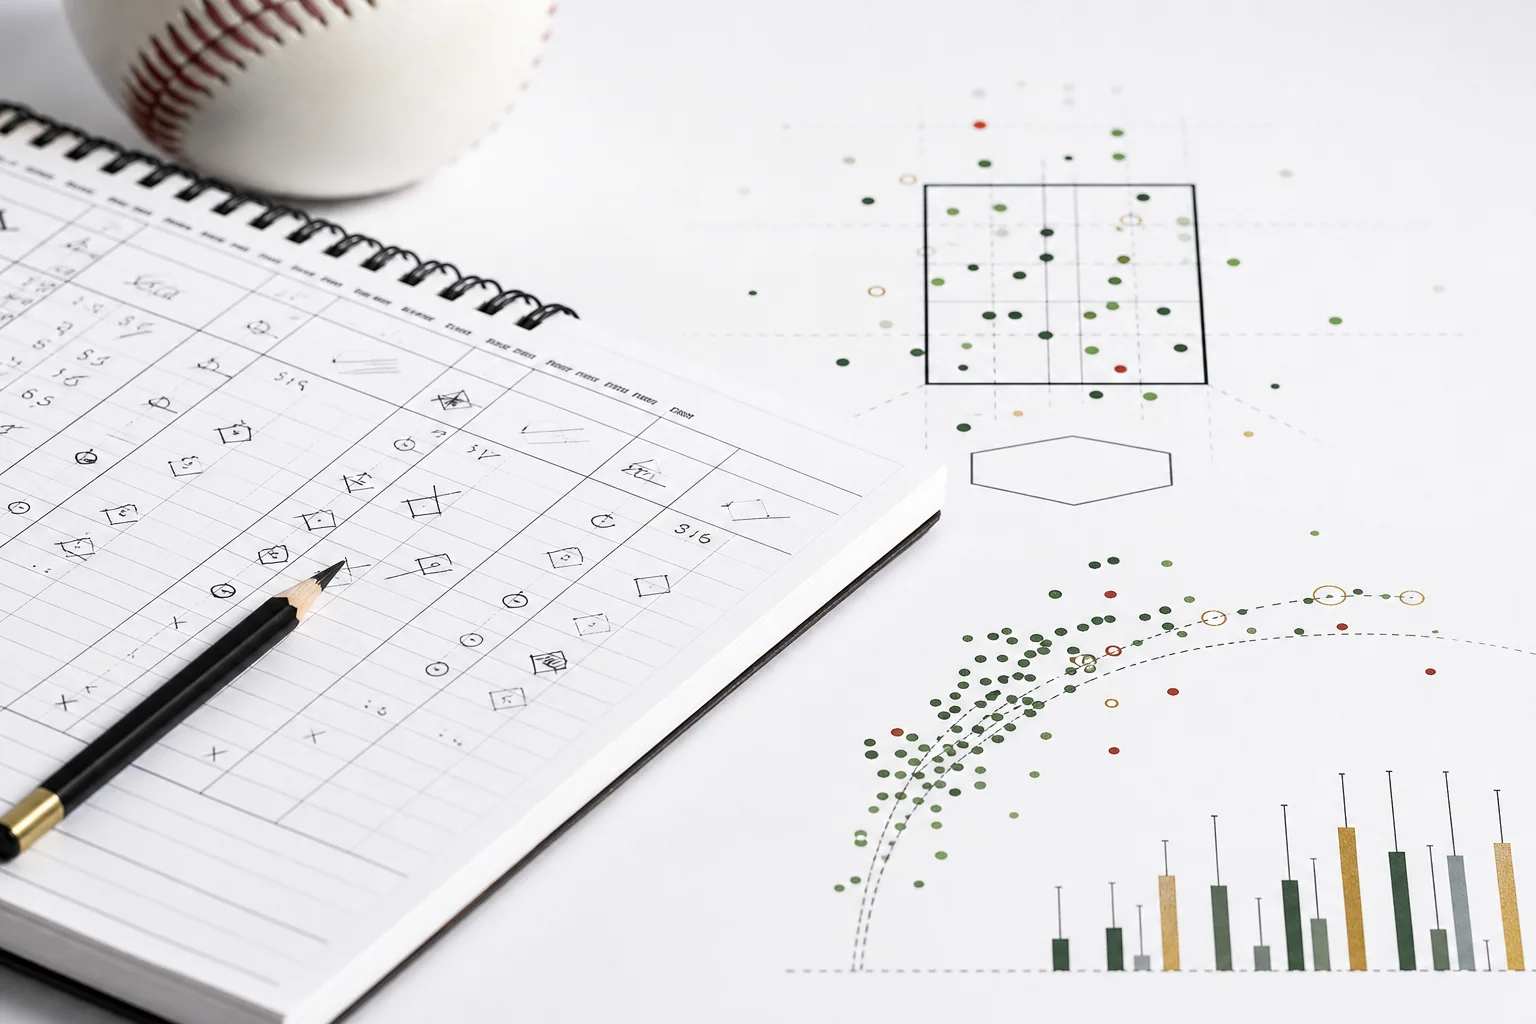
A polished editorial baseball analytics scene with a strike-zone study, scorebook marks, and pitch-tracking traces on a clean white desk.

The rulebook box never moves. The shadow zone around it does — and it tightens when the batter has two strikes.

By the Numbers
3M
Pitches analyzed
12
Seasons of Statcast
83
Umpires graded
45
Investigations published

The Investigations

All analysis →
Team Trends

The Anatomy of a Slump: What Eleven Straight Losses Actually Tell You

Four teams hit the skids in July — the Marlins lost eleven straight, the first ten all by three runs or fewer — so we decomposed every slump and then backtested 491 of them from 2021-2025 to ask what a slump predicts about the next 30 games. Almost nothing: no detail of the slump (depth, luck, close losses, bullpen form) adds any out-of-sample power beyond season record and season xwOBA differential, a null that survived an independent 33-feature machine-learning attack. Close losses predict nothing. 'They're due' predicts nothing. The famous streak cliff is mostly survivorship arithmetic — controlled for who's playing, streak length adds no resolvable next-game effect, just a small monthly drag. One signal survives: cold bats revert. Forecasts for all seven July slumpers are on the record, with honest bands, graded publicly in 30 days. Miami: .48, band .44-.52.
July 26, 2026 · 11 min read
Methodology

The Re-Test Report: We Promised Six Follow-Ups. Here's What Held.

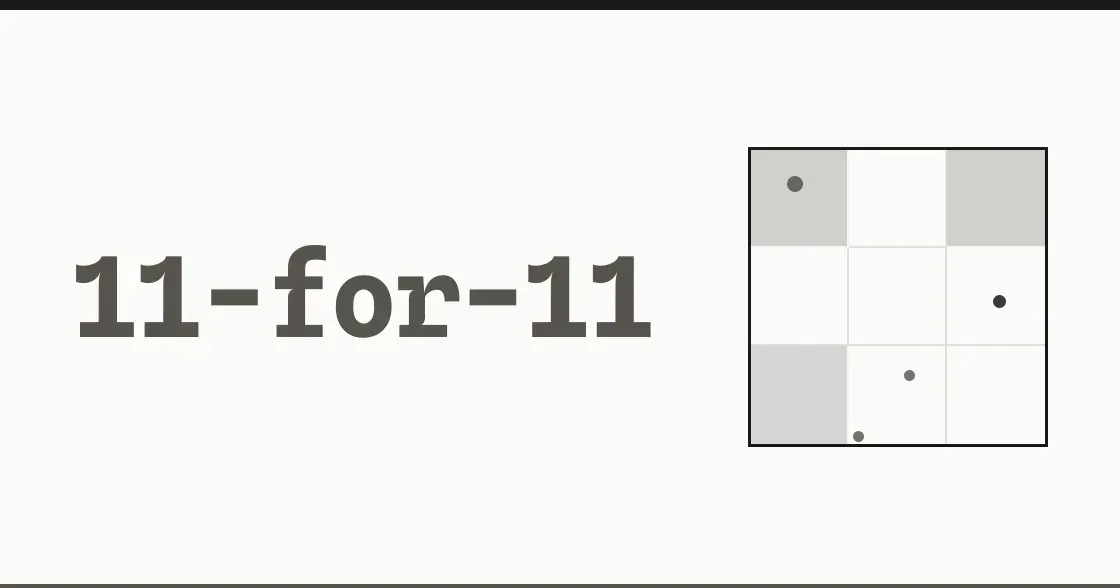
Since April our public Research Queue has carried due dates for re-testing early findings on more data. At the All-Star break we ran all six re-tests — the original methodologies, no new choices, roughly twice the data. Four held or strengthened: the April Sell List went 11-for-11 against its frozen projections, 79 of 80 umpires really are calling better games under ABS (+2.35 points), the bat-speed effect graduated to clear zero, and the arm-angle carry tax now clears both tests. One weakened: the walk-spike piece's three named relievers all fell under our own pre-registered stability filter, and we've posted the correction. Mechanisms replicated; small-sample leaderboards of names did not — exactly what our reliability work predicts.

July 25, 2026 · 9 min read
Pitchers

What Travels

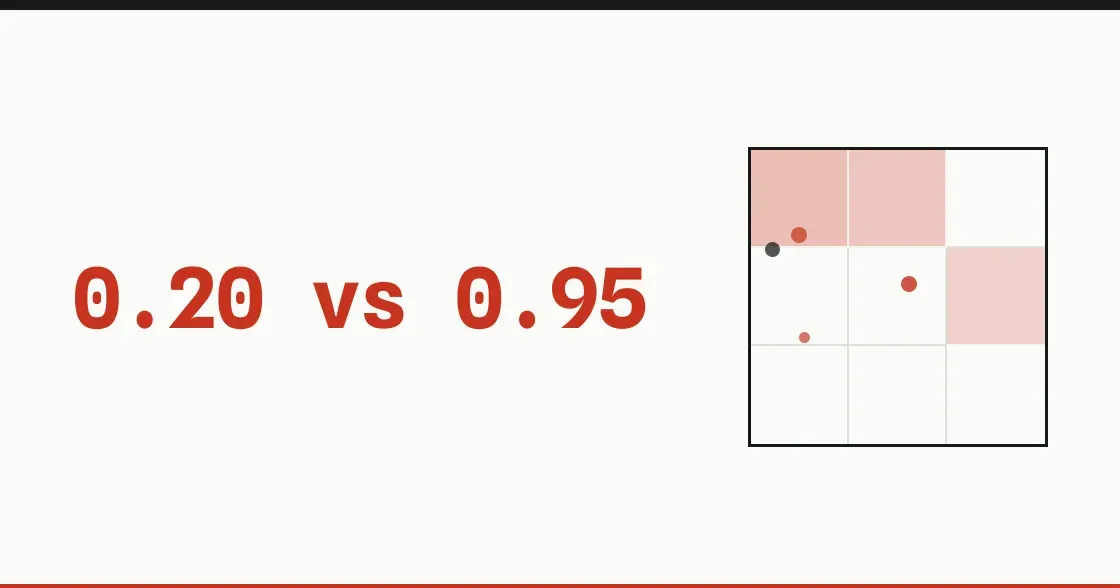
Deadline week runs on one ritual: a pitcher gets traded and everyone reads his ERA. Our research says that's close to backwards. The arm travels — release, spin, and velocity repeat at 0.90–0.97, the most reliable things in the sport. The brain travels — a starter's edge over his own stuff is ~85% pitcher-owned, not a gift from his park or catcher. What doesn't travel is the thing on the trade graphic: the half-season line, which repeats at 0.10–0.23. And since most deadline trades are relievers: the ledger your new setup man was traded on repeats at 0.17. A field guide to reading your team's new pitcher, assembled from four verified CalledThird studies.

July 23, 2026 · 7 min read
The Long Read

The Best Seat in the House

Winning an ABS challenge is close to a coin flip, and 'best challenger' leaderboards are mostly noise. But the catcher wins 59% to the hitter's 48% — the best seat in the house is the one real edge.

The findingABS
59% vs 48%

Catchers overturn 59% of the calls they challenge; hitters, 48%. Individual challenge 'skill' is mostly luck, but the catcher's view is a real, sizable, repeatable edge — and it grows on the more obvious misses.

Read the analysis →

One investigation a week. No hot takes, just the receipts.

CalledThird Weekly lands in your inbox during the season. Under 500 words — we respect your time.

Or follow on Twitter/X · Bluesky